The most basic and important step during chart analysis is marking the support and resistance areas. Support and Resistance play an integral part in any successful trading strategy. So first lets look in to what is support and resistance.

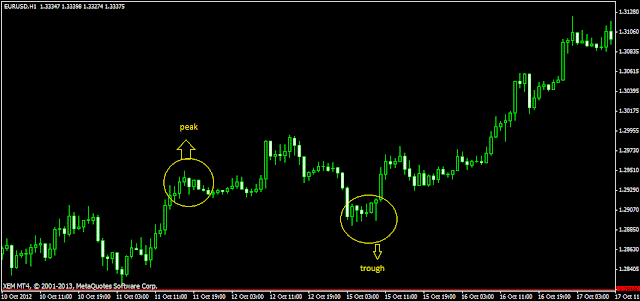
Let's look in to a candlestick chart of EUR-USD.

In this chart we can see that the price is moving up.The price on 10th October was around 1.2868 and as on 17th October it is around 1.3117. So the price has moved up for about 249 pips. But the movement is not through a straight line. After 10th October the price has come down and the again went up till 11th October then again it came down and so on.The price has created a number of high's and low's before reaching the value of 1.3117.
The yellow circle you see in the chart is one such high and it is called a PEAK.
The other circle shows you a low,which is called a TROUGH.
Why peaks and Troughs?
When the price goes up to a particular level further advancement become impossible. At this stage the sellers will become as powerful as the buyers. Then the price falls. This is how a Peak is formed.
As the buyers regain their strength the price again moves up creating a Trough. By looking at the position of peaks and troughs a trader will be able to say whether that particular currency is Trending up,down or ranging.
Now look at the chart above.
The first rectangle shows that price is trying to move up.At this point the sellers are resisting the move. The strength of buyers and sellers are almost equal at this level and price is not able to move.This is the RESISTANCE LEVEL.The price falls from the resistance level creating a peak.
The second box shows that the price again falls from a peak.But at certain level the buyers regaining their strength arrest the downward journey. The price could not go down further.This is the SUPPORT level. The currency finds a support at that particular level and bounces back.
The red line drawn through the chart indicates the Resistance and support Level.
Importance of Support and Resistance
- Support and resistance are psychological barriers.
- Once a support or resistance level are formed in future price may stop at these levels
- They can be used as stop loss or take profit levels as chances are there that price will halt at this level again.
- During trading the best entry points can be found using these levels.
- Support and resistance are usually zones: In most cases we will not be able to mark the support and resistance level as single line.when one or more levels can be drawn in same area they are called zones. They are more powerful.
- A broken Resistance will act as support: Once the price breaks a very important resistance level, during the forward journey the price will come down and test that level.This time that level will act as a support. if you are a trend trader it is advisable to enter an upward trend after the price has tested it's previous important resistance level.
See the chart above. The price is trying to move up. box 1 shows the price breaking the resistance level. Then again price moves down. Box 2 indicates the price testing the level. Now that level is a support and the price moves up.
How to draw support and Resistance?
Support and Resistance levels can be drawn by drawing a horizontal line through each significant peak and trough.Line can be drawn either through the close of candle or through the low.The more the number of candles testing the line the more strong the level.


No comments:
Post a Comment